Not much. But let’s benchmark it using two VPS servers connected via a private network. We’ll target some post on the forum to force vpub-plus to re-render the it repeatedly (since there’s no caching in place - we need to render it every time).
Here’s our current setup:
Hetzner CCX23
Both benchmark server and the vpub-plus container are running on 2 x 4VCPU, 16GB RAM servers.
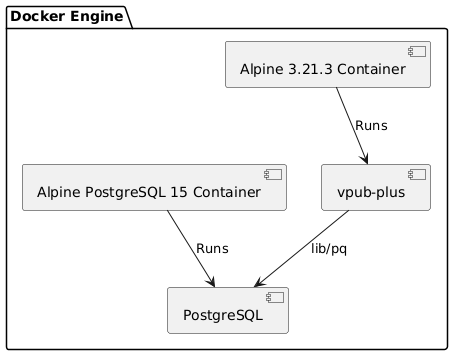
Here we are running Postgres and vpub-plus in Docker on the same machine.
- Peak RAM usage was around 400MB, but those 4 poor VCPUs were fully – truly 100% – loaded!
- Network rx ~8MiB/s, tx ~6MiB/s (22K pkts/s).
Results for vpub-plus 1.13 with Blackfriday renderer:
$ ./oha-linux-amd64 -z 10m --latency-correction --disable-keepalive http://10.0.0.2:1337/topics/1
Summary:
  Success rate: 100.00%
  Total:        600.0085 secs
  Slowest:      0.6353 secs
  Fastest:      0.0023 secs
  Average:      0.0846 secs
  Requests/sec: 591.0700

  Total data:   1.42 GiB
  Size/request: 4.21 KiB
  Size/sec:     2.43 MiB

Response time histogram:
  0.002 [1]      |
  0.066 [248370] |■■■■■■■■■■■■■■■■■■■■■■■■■■■■■■■■
  0.129 [11338]  |■
  0.192 [23493]  |■■■
  0.256 [29430]  |■■■
  0.319 [28197]  |■■■
  0.382 [11427]  |■
  0.445 [2062]   |
  0.509 [230]    |
  0.572 [43]     |
  0.635 [10]     |

Response time distribution:
  10.00% in 0.0078 secs
  25.00% in 0.0147 secs
  50.00% in 0.0292 secs
  75.00% in 0.1480 secs
  90.00% in 0.2682 secs
  95.00% in 0.3070 secs
  99.00% in 0.3690 secs
  99.90% in 0.4365 secs
  99.99% in 0.5222 secs


Details (average, fastest, slowest):
  DNS+dialup:   0.0004 secs, 0.0002 secs, 0.0095 secs
  DNS-lookup:   0.0000 secs, 0.0000 secs, 0.0003 secs

Status code distribution:
  [200] 354601 responses

Error distribution:
  [46] aborted due to deadline
However if we going to benchmark just the main page (which does not involve Blackfriday to render anything, only relies on template/html and look up for settings + session) then we get around 928 req/s.
Hetzner CAX41
Same setup, but this time around this is a ARM64 server (Ampere). 16VCPUs, 32GB RAM.
- Peak RAM usage was around 450MB, 16 VCPUs were fully – truly 100% – loaded again!
- Network rx ~13.5MiB/s, tx ~9.5MiB/s (33K pkts/s).
$ ./oha-linux-arm64 -z 10m --latency-correction --disable-keepalive http://10.0.0.2:1337/topics/1
Summary:
  Success rate:	100.00%
  Total:	600.0026 secs
  Slowest:	0.2787 secs
  Fastest:	0.0029 secs
  Average:	0.0622 secs
  Requests/sec:	804.1798

  Total data:	1.73 GiB
  Size/request:	3.76 KiB
  Size/sec:	2.95 MiB

Response time histogram:
  0.003 [1]      |
  0.030 [157315] |■■■■■■■■■■■■■■■■■■■■■■■■■■■■■■■■
  0.058 [50276]  |■■■■■■■■■■
  0.086 [126809] |■■■■■■■■■■■■■■■■■■■■■■■■■
  0.113 [114347] |■■■■■■■■■■■■■■■■■■■■■■■
  0.141 [25383]  |■■■■■
  0.168 [6697]   |■
  0.196 [1373]   |
  0.224 [230]    |
  0.251 [26]     |
  0.279 [4]      |

Response time distribution:
  10.00% in 0.0152 secs
  25.00% in 0.0228 secs
  50.00% in 0.0677 secs
  75.00% in 0.0903 secs
  90.00% in 0.1069 secs
  95.00% in 0.1197 secs
  99.00% in 0.1508 secs
  99.90% in 0.1865 secs
  99.99% in 0.2164 secs


Details (average, fastest, slowest):
  DNS+dialup:	0.0005 secs, 0.0002 secs, 0.0260 secs
  DNS-lookup:	0.0000 secs, 0.0000 secs, 0.0023 secs

Status code distribution:
  [200] 426335 responses
  [500] 55857 responses
  [404] 269 responses

Error distribution:
  [49] aborted due to deadline
This time around there’s an interesting issue – dial tcp 172.18.0.2:5432: connect: cannot assign requested address – that’s what I like to see! Meaning that we are exceeding the number of local socket connections. Let’s fix it real quick by adding those 3 little lines of code:
// storage/db.go

db.SetMaxIdleConns(64)
db.SetMaxOpenConns(64)
db.SetConnMaxLifetime(time.Minute)
And test again!
- Peak RAM usage was around 530MB and our 16VCPUs are loaded for about 60-70% each.
- Network rx 40MiB/s, tx ~24MiB/s (86K pkts/s).
./oha-linux-arm64 -z 5m --latency-correction --disable-keepalive http://10.0.0.2:1337/topics/1
Summary:
  Success rate:	100.00%
  Total:	300.5233 secs
  Slowest:	0.1424 secs
  Fastest:	0.0036 secs
  Average:	0.0173 secs
  Requests/sec:	2887.1035

  Total data:	3.48 GiB
  Size/request:	4.21 KiB
  Size/sec:	11.86 MiB

Response time histogram:
  0.004 [1]      |
  0.017 [493959] |■■■■■■■■■■■■■■■■■■■■■■■■■■■■■■■■
  0.031 [358460] |■■■■■■■■■■■■■■■■■■■■■■■
  0.045 [13405]  |
  0.059 [1362]   |
  0.073 [279]    |
  0.087 [92]     |
  0.101 [42]     |
  0.115 [16]     |
  0.129 [20]     |
  0.142 [6]      |

Response time distribution:
  10.00% in 0.0115 secs
  25.00% in 0.0141 secs
  50.00% in 0.0168 secs
  75.00% in 0.0197 secs
  90.00% in 0.0233 secs
  95.00% in 0.0260 secs
  99.00% in 0.0350 secs
  99.90% in 0.0515 secs
  99.99% in 0.0867 secs


Details (average, fastest, slowest):
  DNS+dialup:	0.0057 secs, 0.0002 secs, 0.0575 secs
  DNS-lookup:	0.0000 secs, 0.0000 secs, 0.0040 secs

Status code distribution:
  [200] 867642 responses
Todo: try out PGTune
4 x CAX41 cluster
Let’s make it a little bit more fun. I’ll grab my Ansible and…
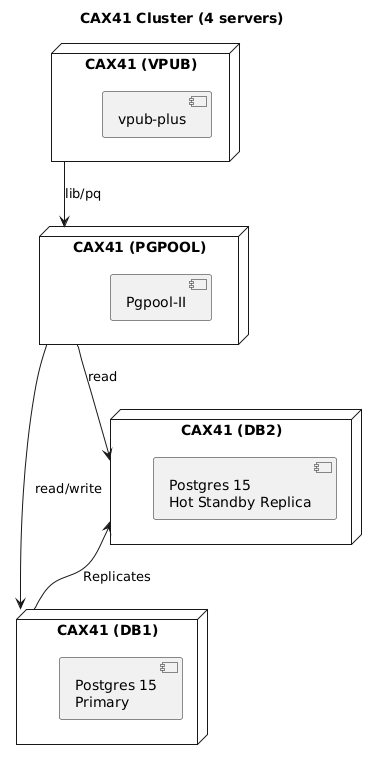
And here’s the result:
./oha-linux-arm64 -z 360s --latency-correction --disable-keepalive http://10.0.0.5:1337/topics/1
Summary:
  Success rate: 100.00%
  Total:        359.7985 secs
  Slowest:      120.1263 secs
  Fastest:      0.0068 secs
  Average:      0.0283 secs
  Requests/sec: 1662.7390

  Total data:   2.40 GiB
  Size/request: 4.21 KiB
  Size/sec:     6.83 MiB

Response time histogram:
    0.007 [1]      |
   12.019 [598161] |■■■■■■■■■■■■■■■■■■■■■■■■■■■■■■■■
   24.031 [0]      |
   36.043 [0]      |
   48.055 [0]      |
   60.067 [10]     |
   72.078 [78]     |
   84.090 [0]      |
   96.102 [0]      |
  108.114 [0]      |
  120.126 [1]      |

Response time distribution:
  10.00% in 0.0102 secs
  25.00% in 0.0116 secs
  50.00% in 0.0143 secs
  75.00% in 0.0228 secs
  90.00% in 0.0349 secs
  95.00% in 0.0446 secs
  99.00% in 0.0645 secs
  99.90% in 0.0952 secs
  99.99% in 60.1085 secs


Details (average, fastest, slowest):
  DNS+dialup:   0.0041 secs, 0.0002 secs, 0.1043 secs
  DNS-lookup:   0.0000 secs, 0.0000 secs, 0.0034 secs

Status code distribution:
  [200] 598251 responses
It’s somehow even slower than hosting everything on one CAX41. vpub-plus uses around 20% of the CPU, Pgpool ~50%, the primary Postgres ~46%, and the replica Postgres uses… ~3%. Huh. The Oha server that benchmarked vpub had some random hiccups.
I need to investigate how Pgpool-II works. I also need to look into Postgres replicas. I will update this post if I can utilize resources better.